Introduction
Note: I assume familiarity with PADU itself.
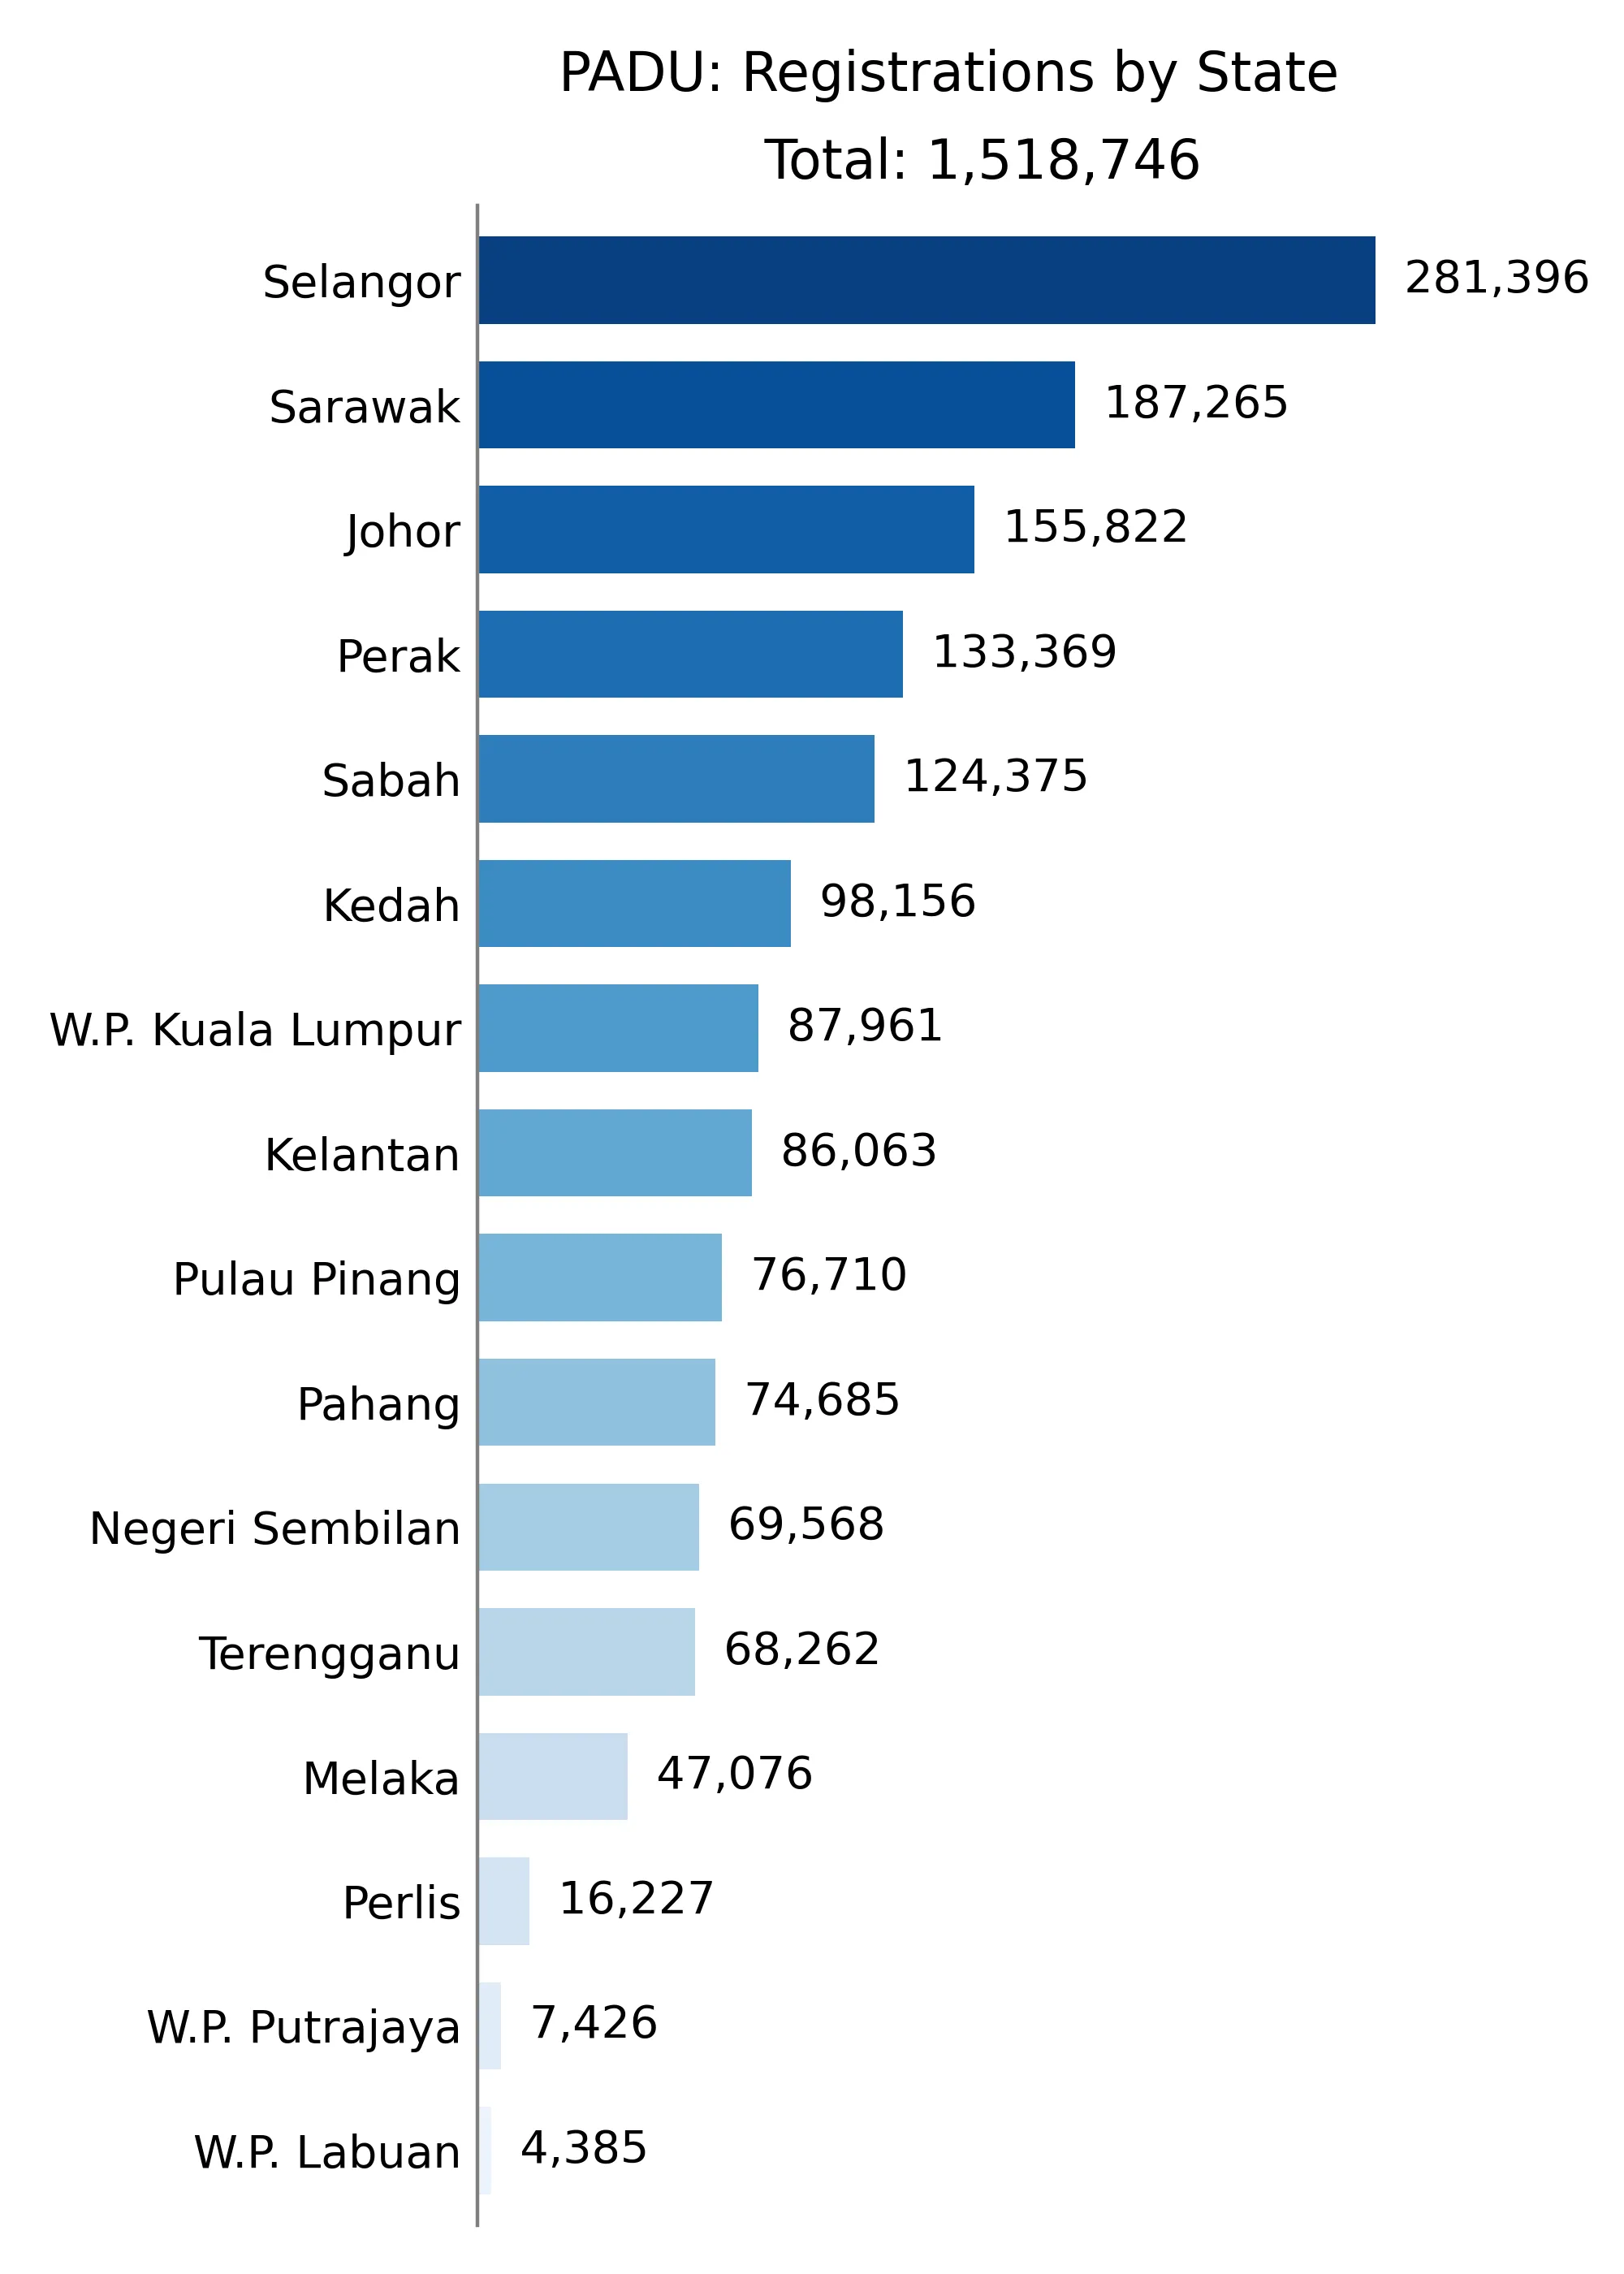
At roughly 0900hrs daily, PADU's official social media puts out the following infographic:
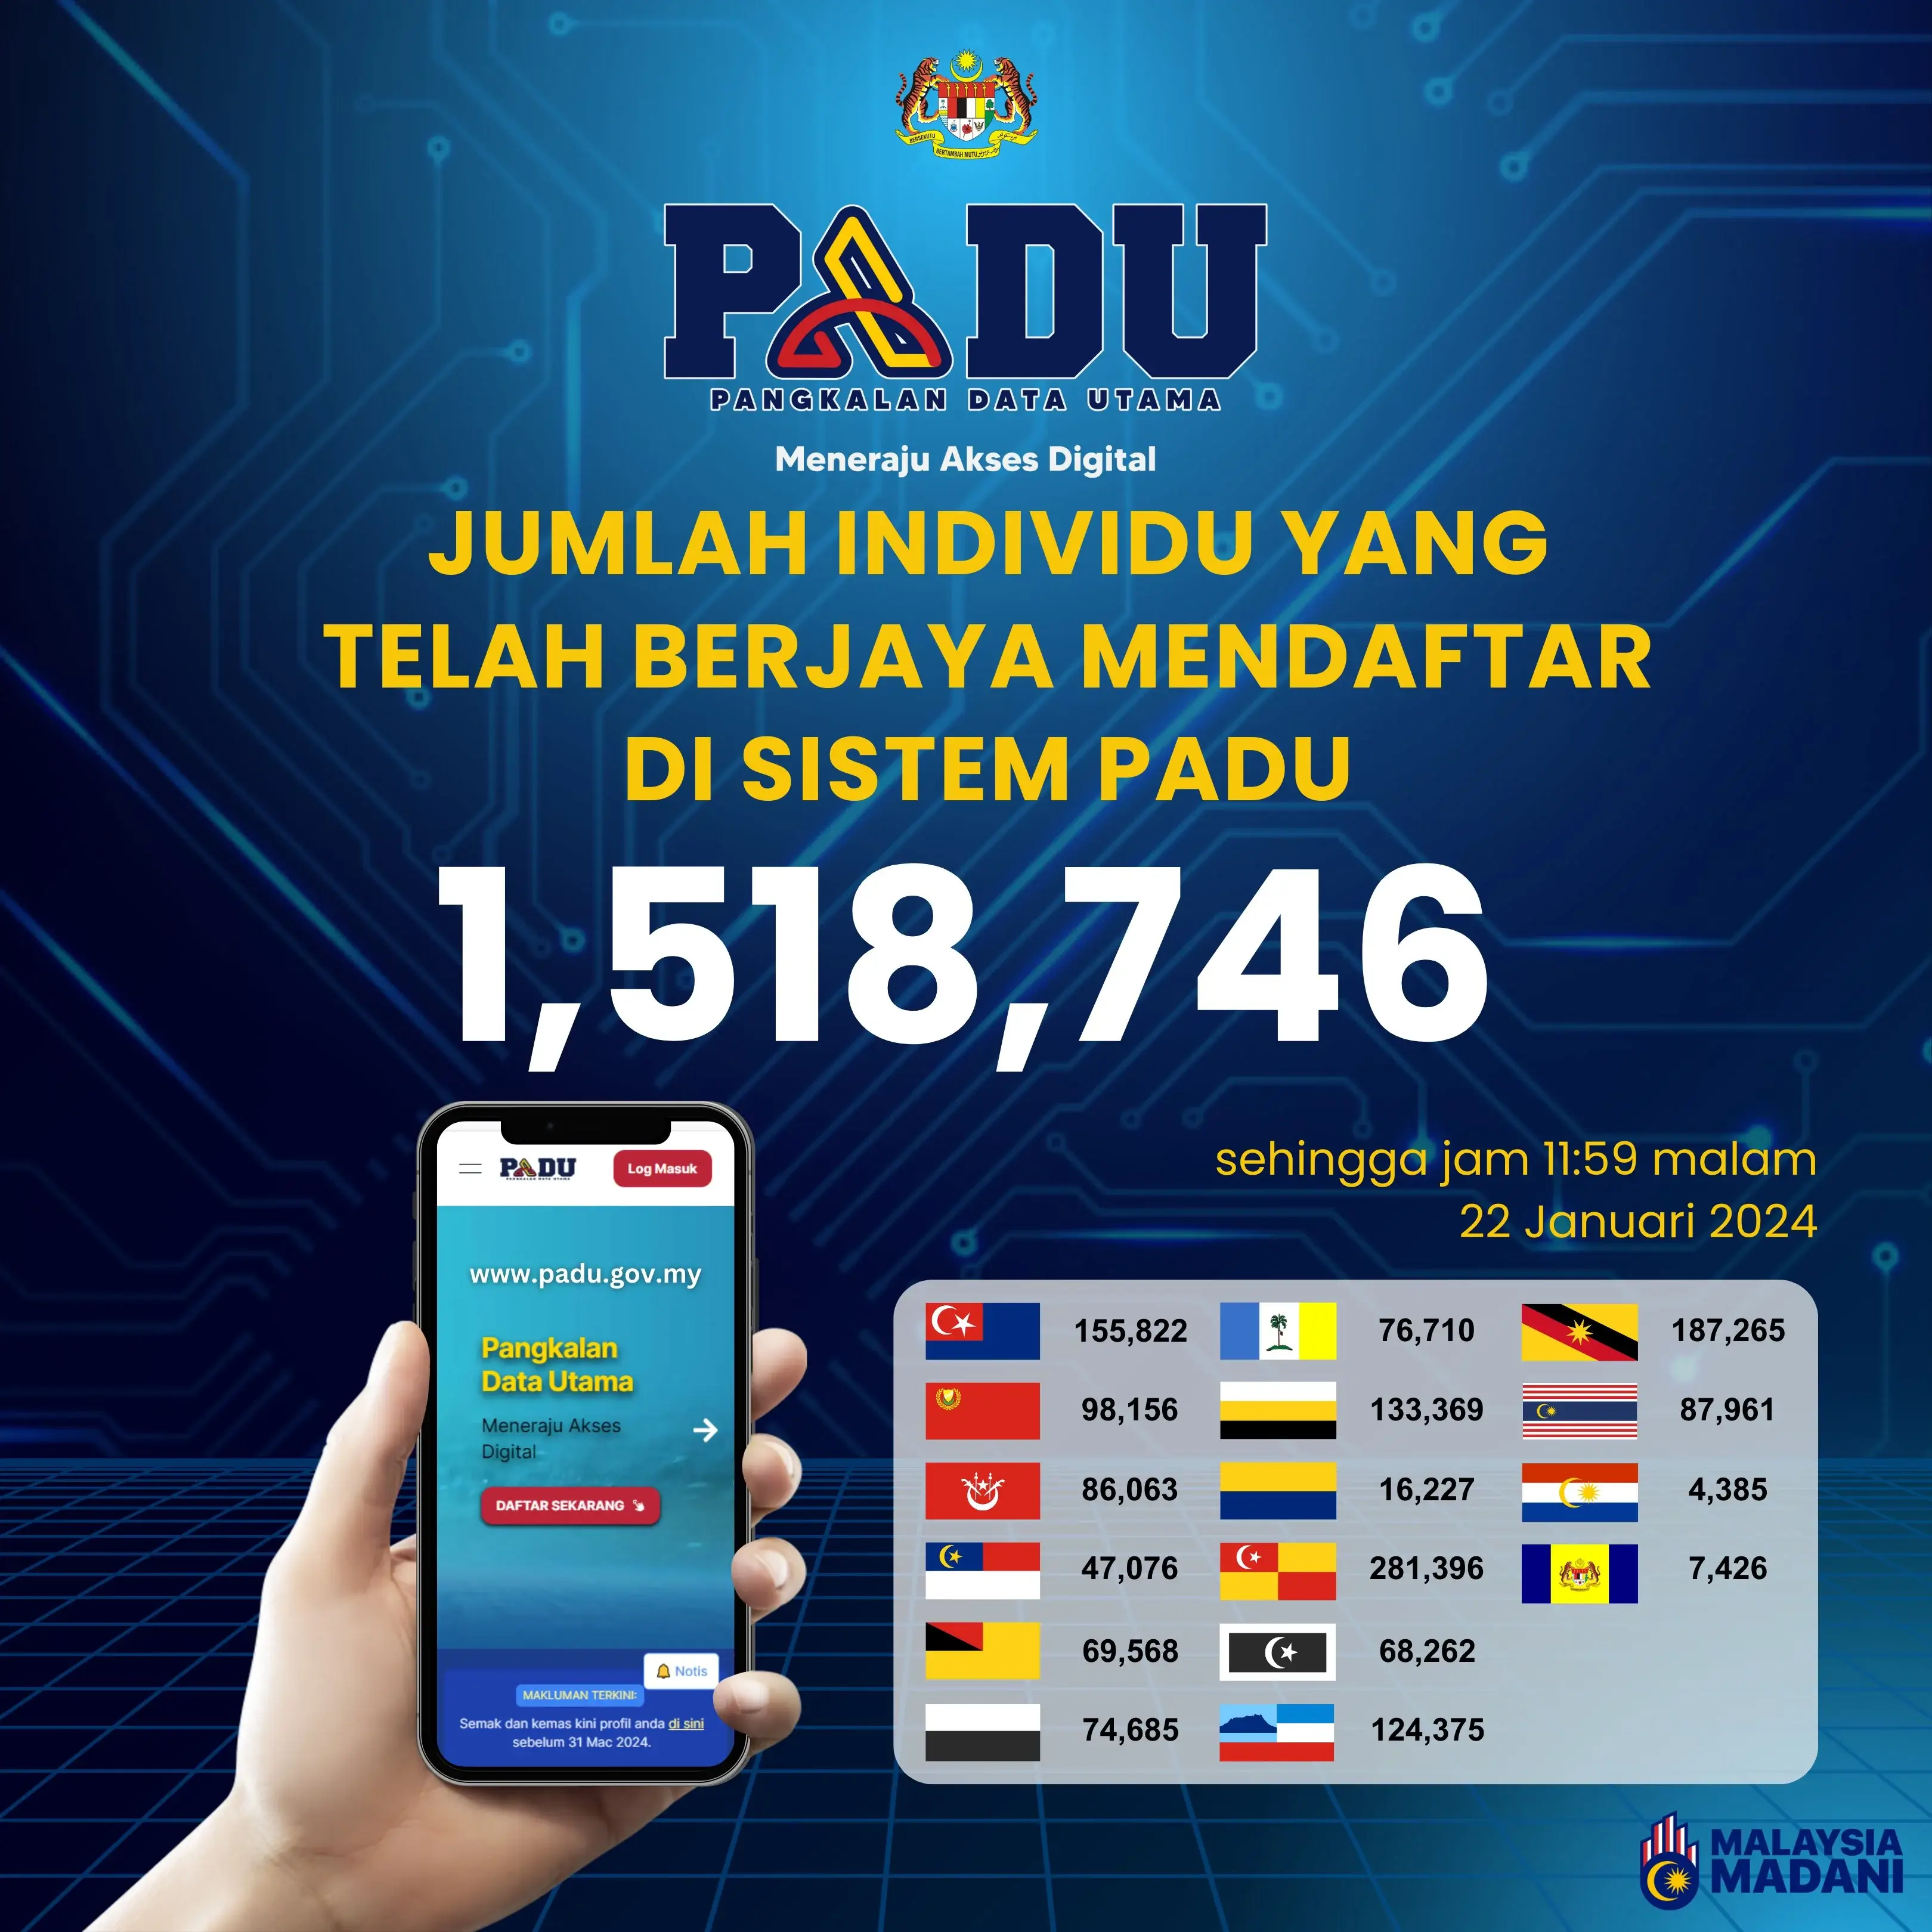
While it is commendable that the team is making an effort to keep the rakyat engaged and motivated using data, I think the quality of the dataviz, data, and data dissemination method leave much to be desired. I want to see the quality of government data get better, so here are some constructive suggestions in all 3 domains.
Better dataviz
The biggest problem with the existing infographic is that the method of presentation is largely meaningless, for 3 reasons:
- There is no sense of trend. When I look at that infographic, I don't know if we're doing better or worse. All I see is a snapshot of how things stood as of 2359hrs the previous day.
- There is no sense of scale. Unless you know the size of the target population (roughly 22 mil adults), you have no idea whether 1.5 mil registrations is good or bad.
- The state-level numbers are misleading. There is a huge difference in the size of states' populations, so (for example), it is an absolute no-brainer that the most populous state (Selangor) will have the highest number of registrants. This tells us nothing until the numbers are scaled against the respective populations.
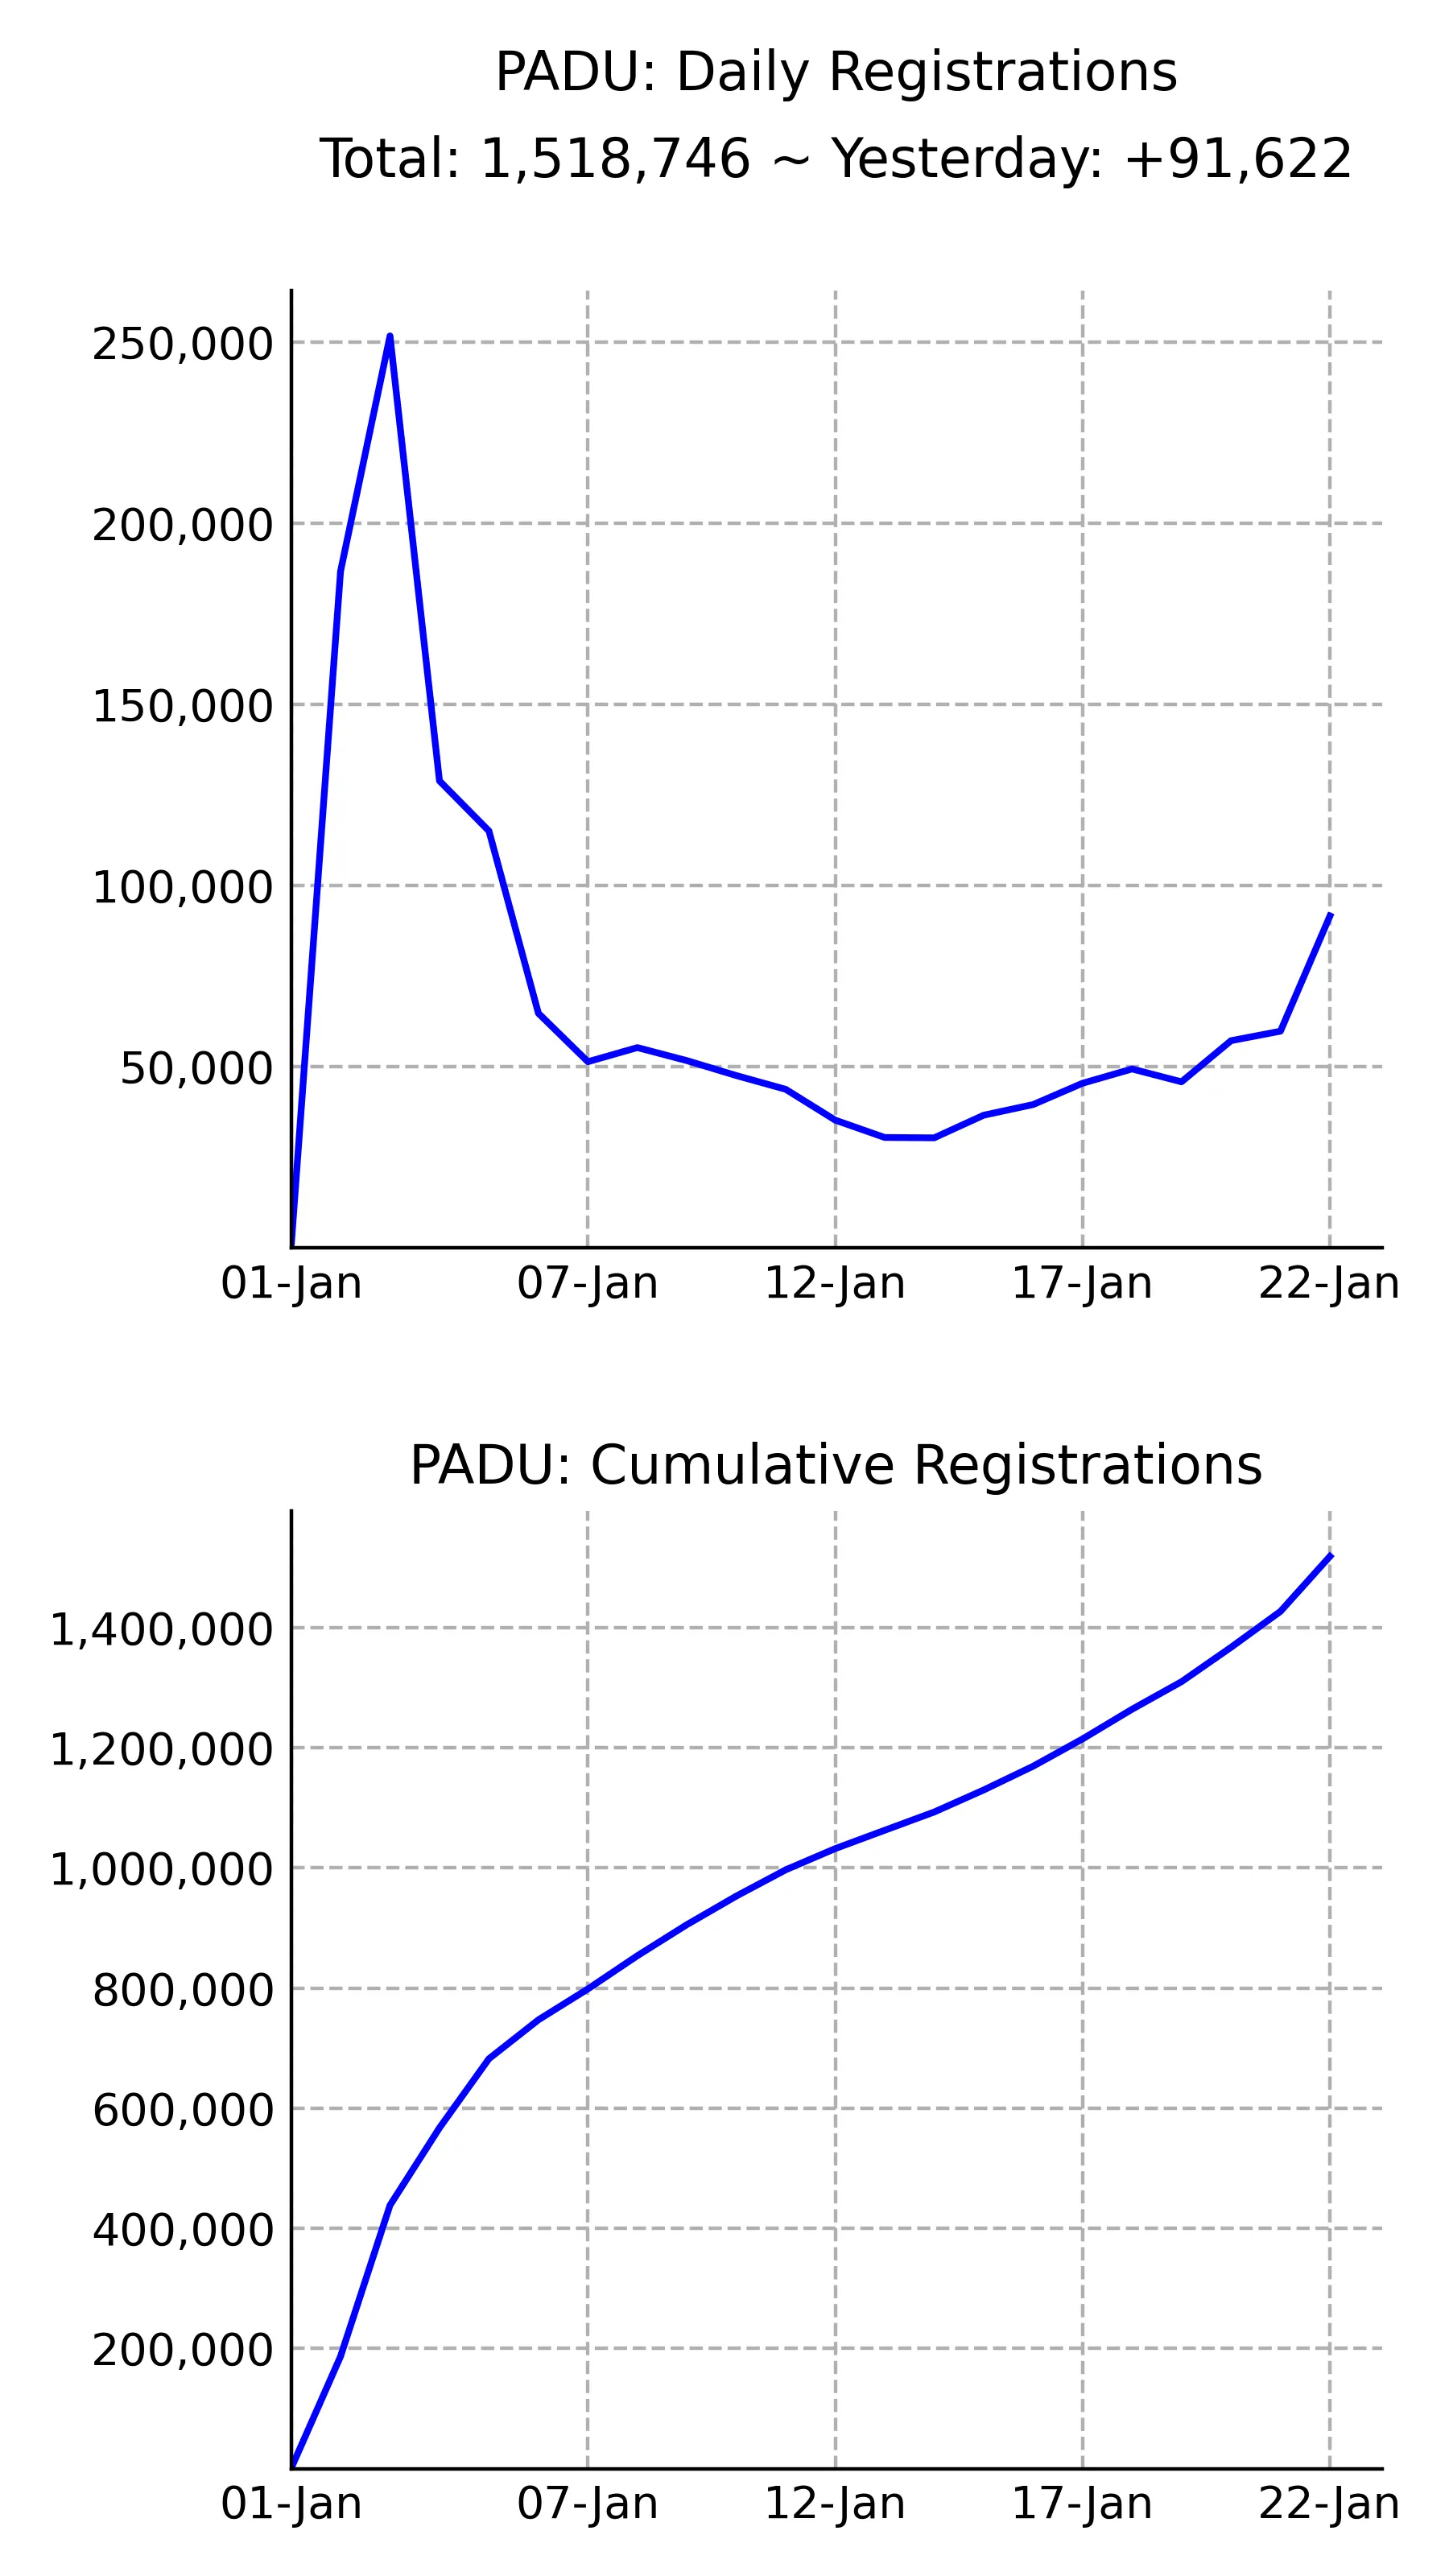
To fix the first problem (no sense of trend), all you need is some timeseries dataviz. This does the job, plotting both daily and cumulative registrations:
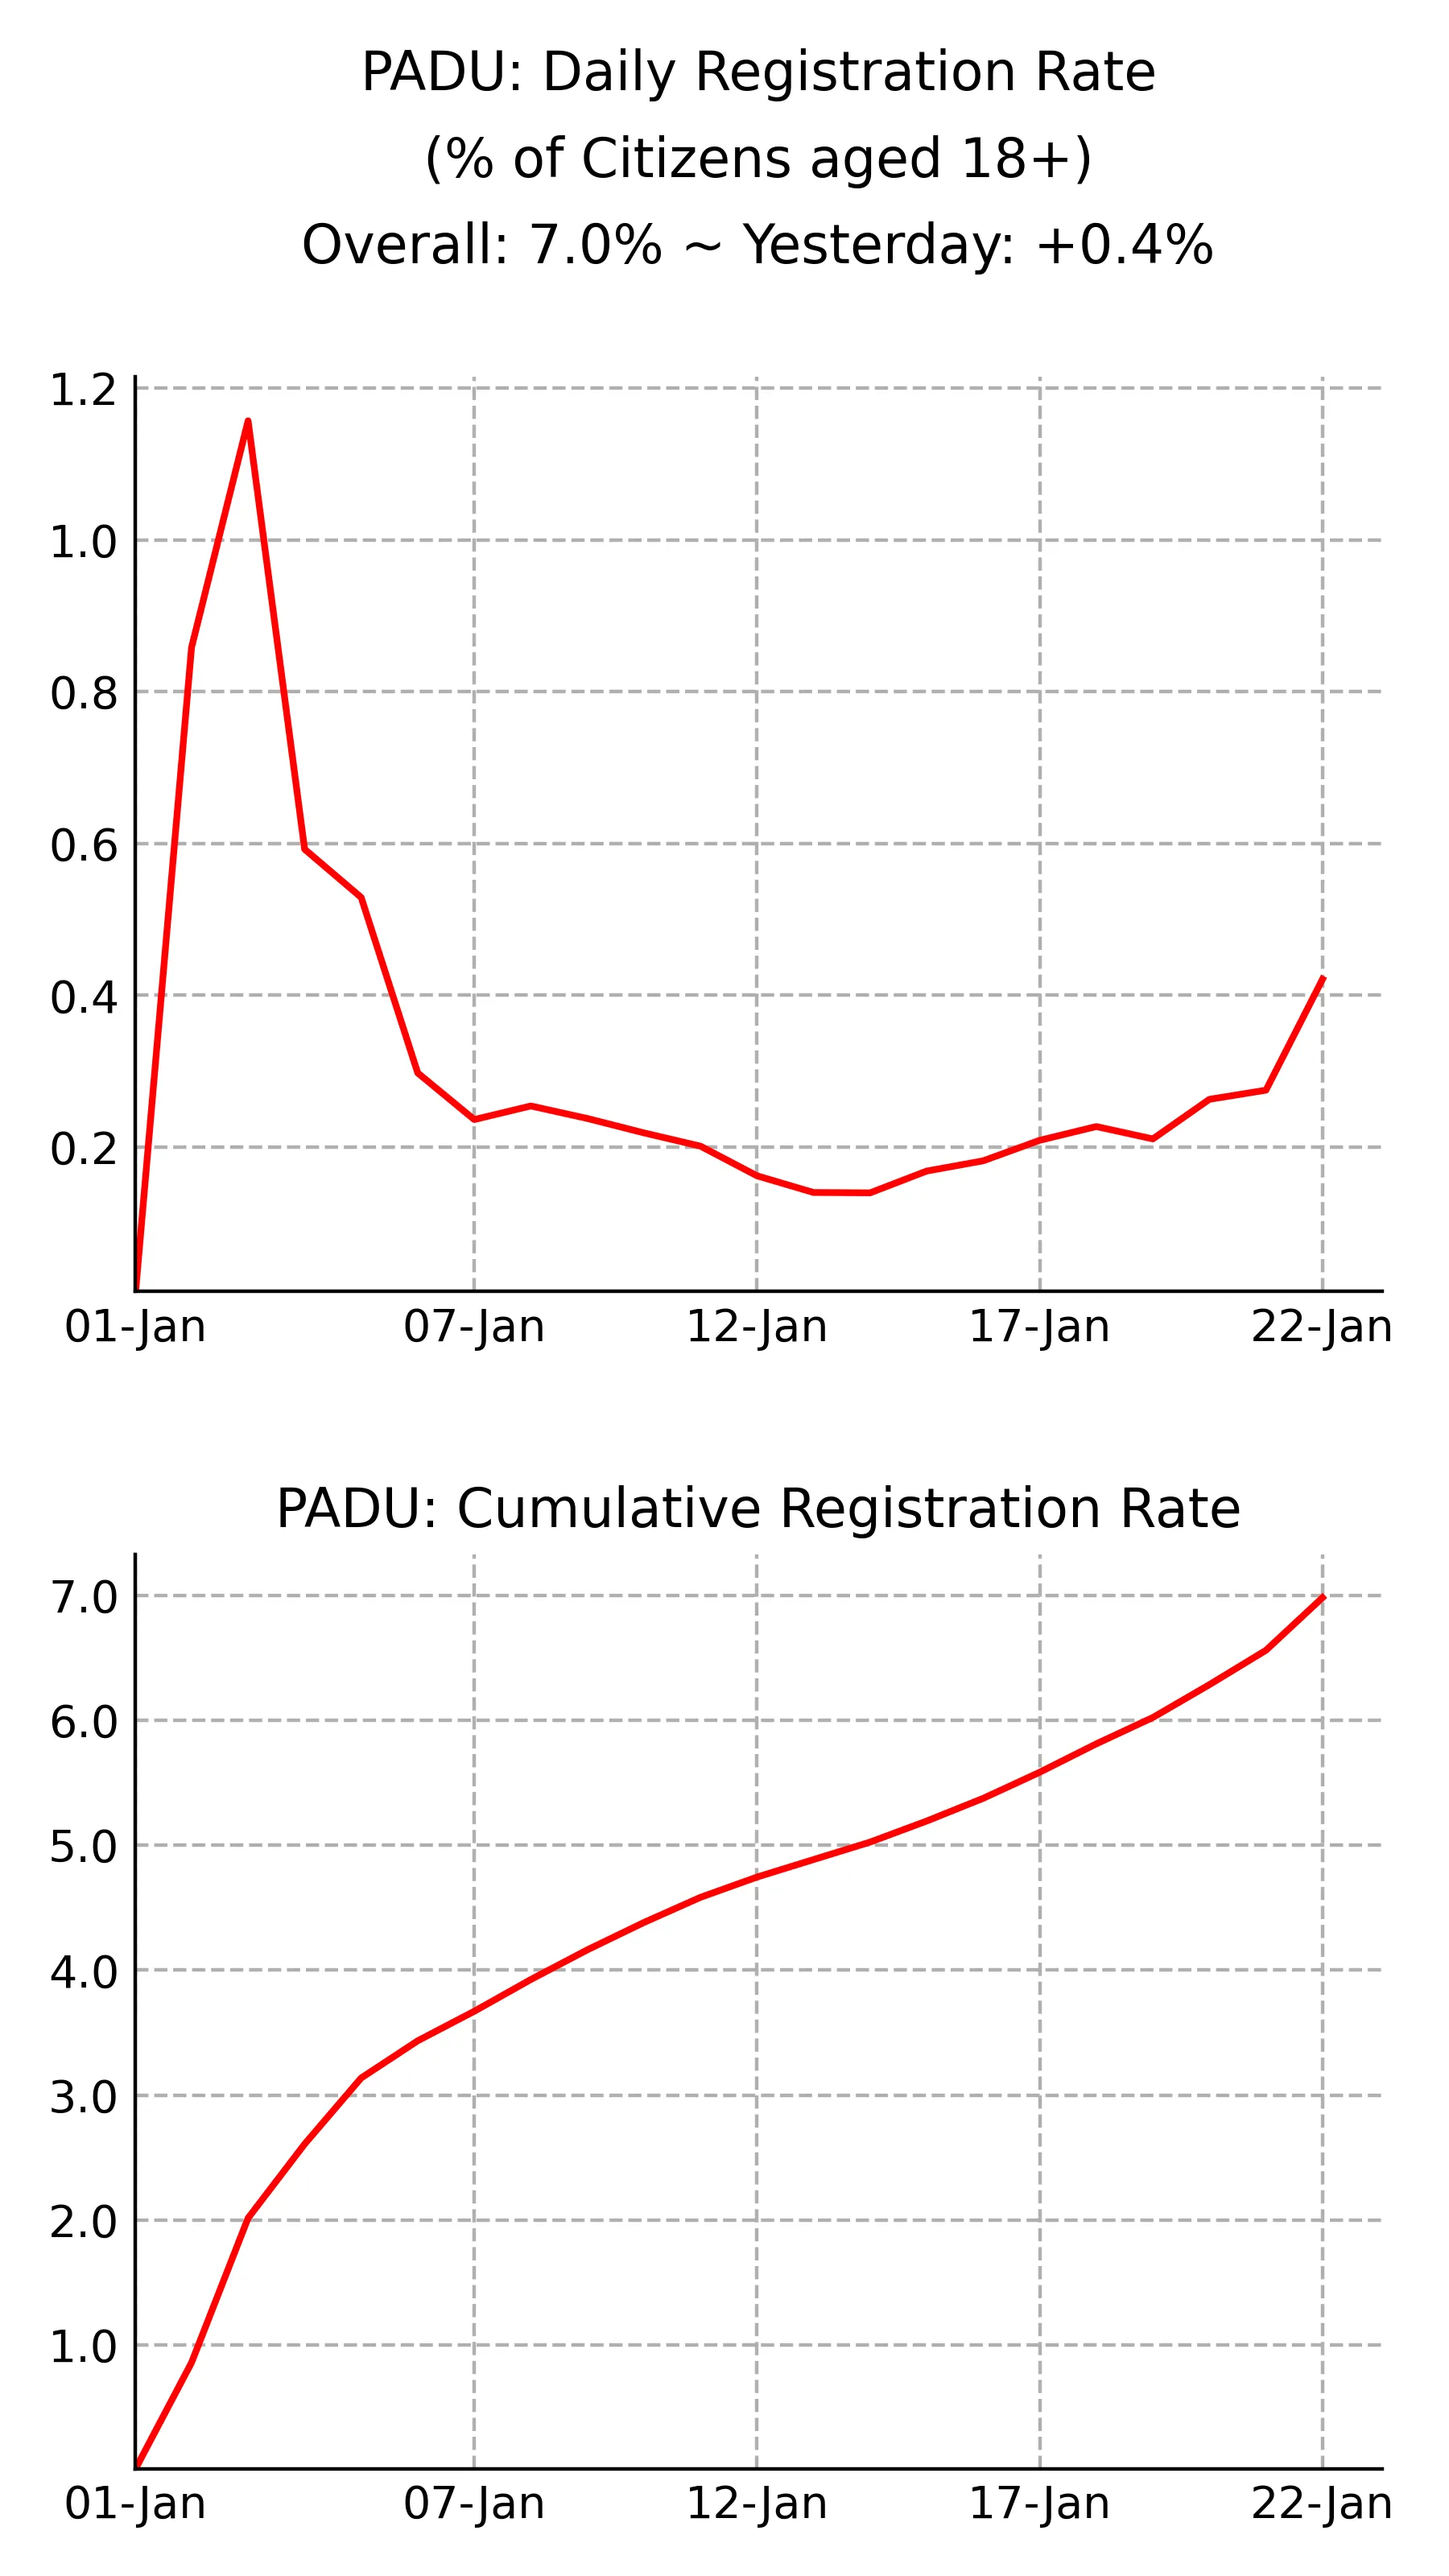
To fix the second problem (no sense of scale), you can plot the exact same data but expressed as a % of the target population rather than in absolute terms. This has direct comparability to the first chart, and has the nice feature that you can easily extrapolate what % will eventually be reached from the most recent daily number:
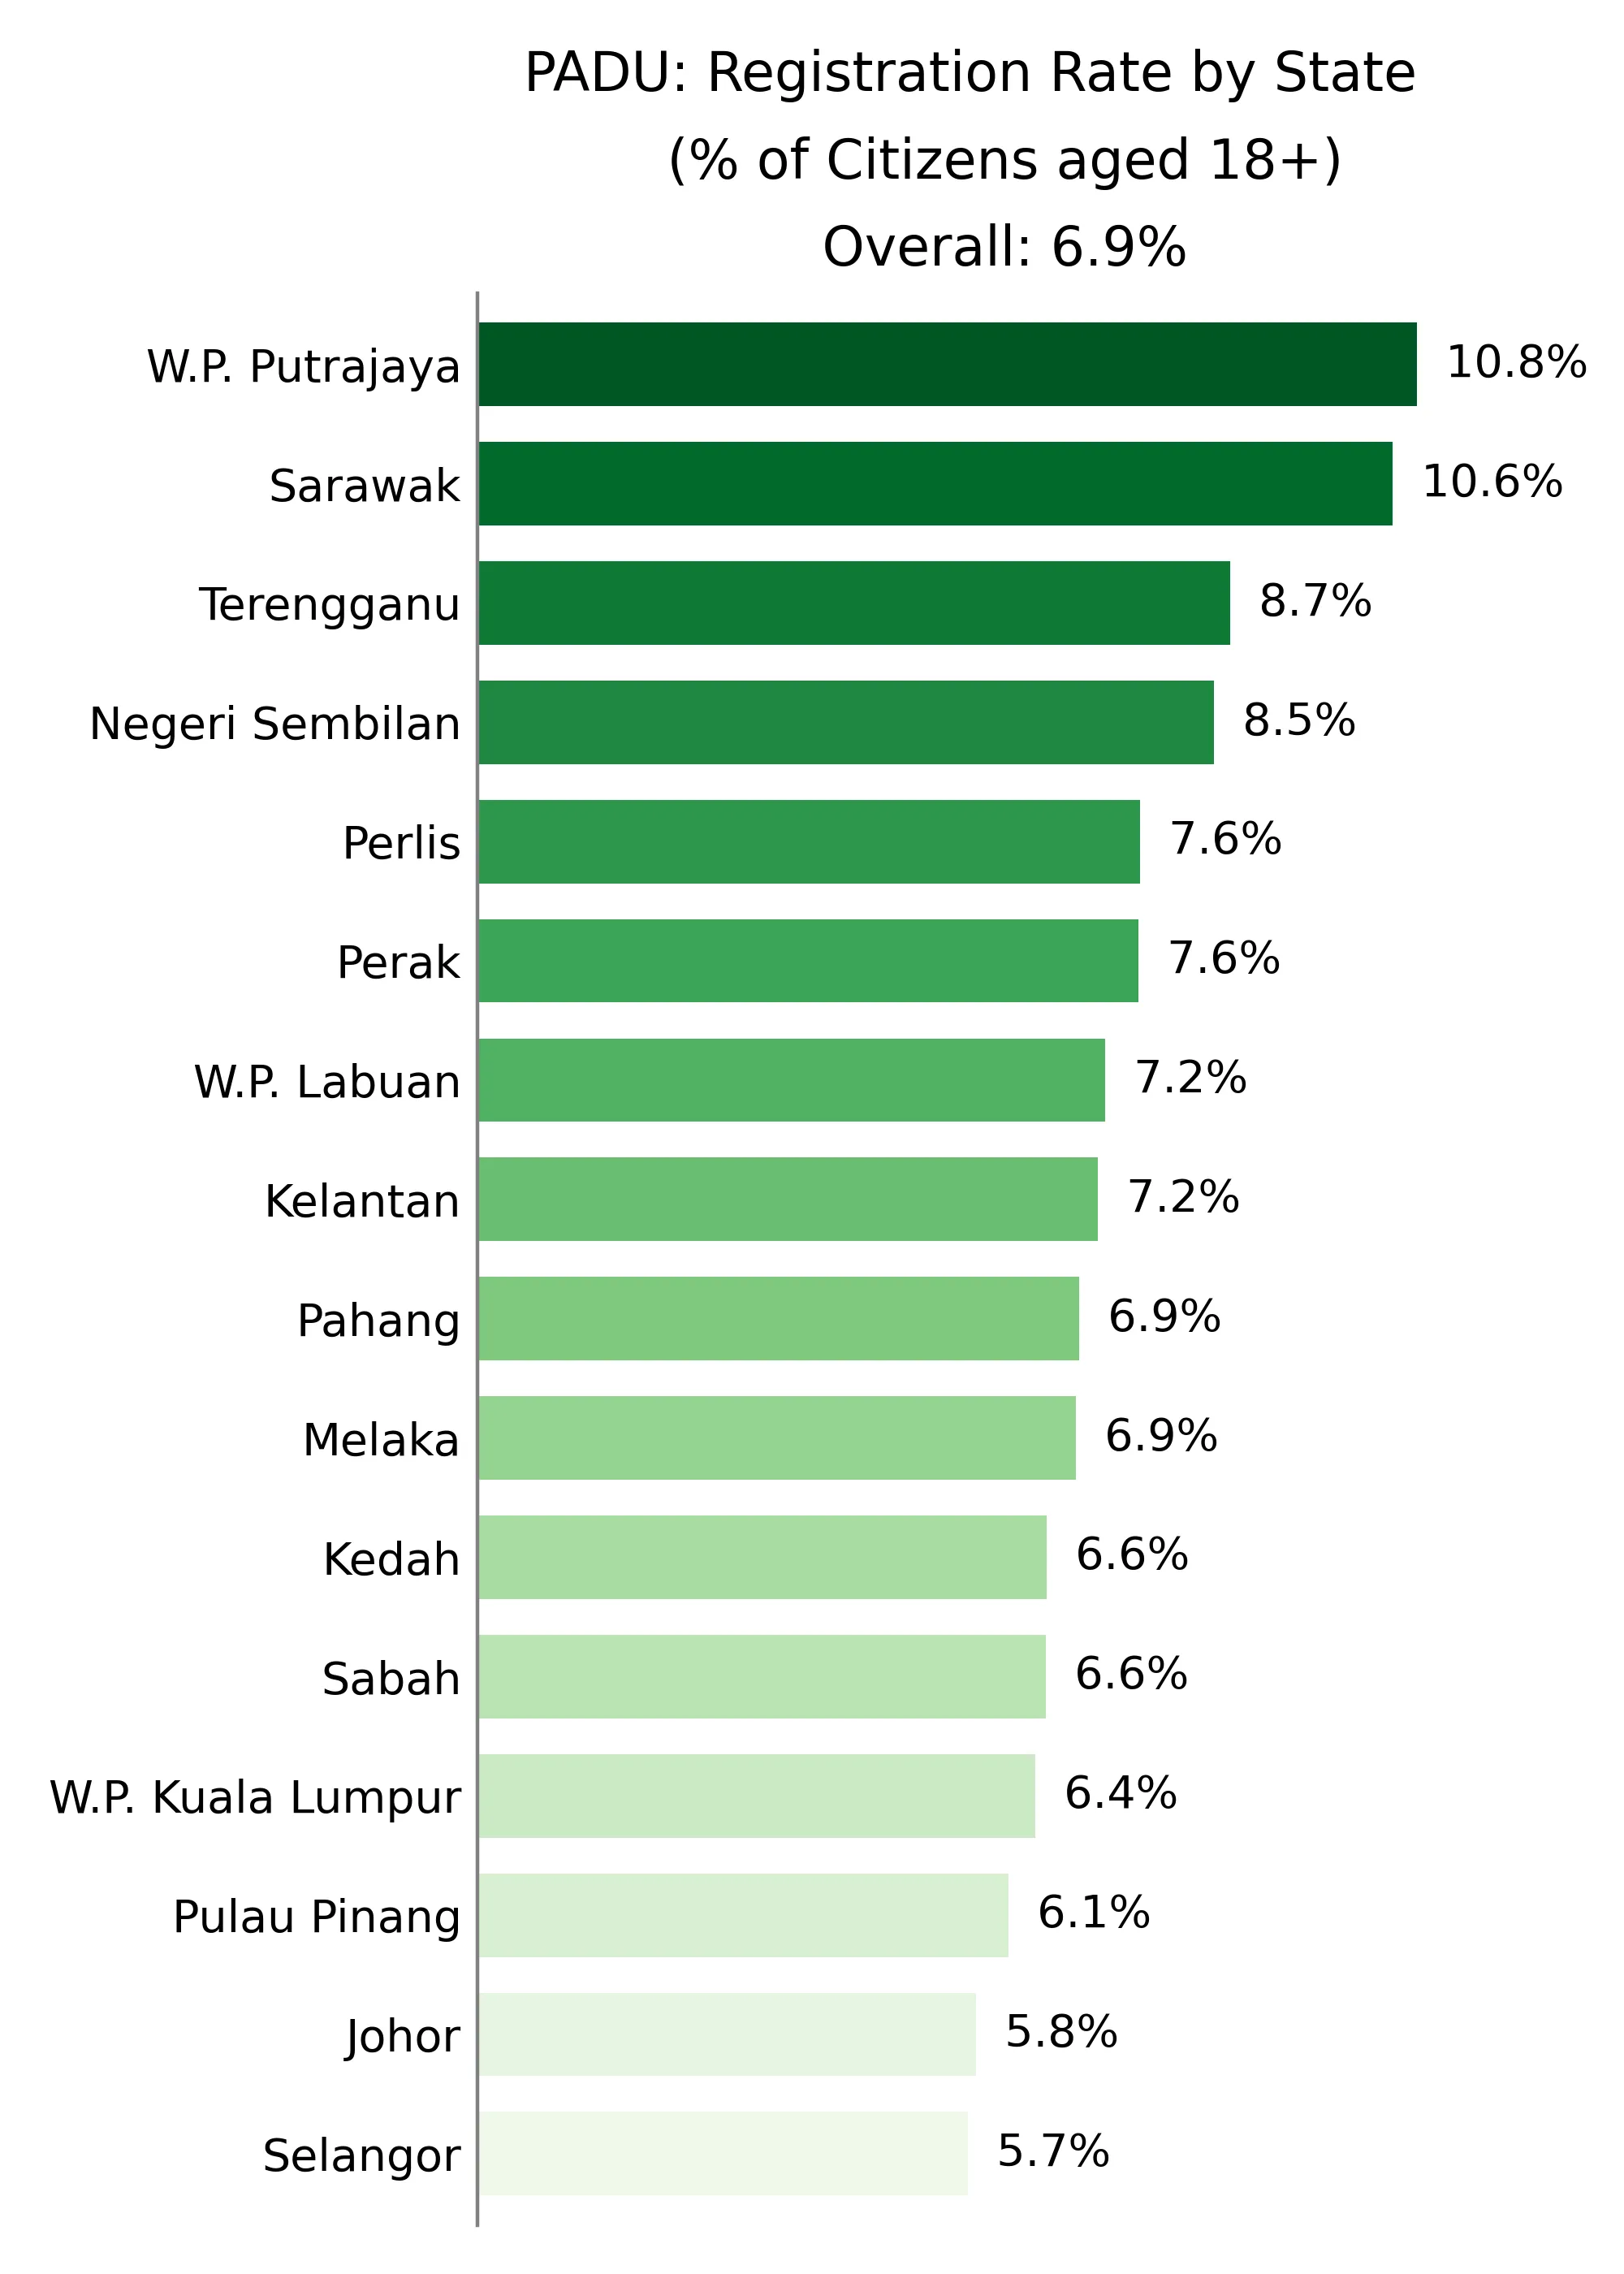
To fix the third problem (misleading comparison between states), you have to scale the data by the size of the target group in each state, and present that data in an easy-to-read manner (e.g. a simple sorted bar chart). I think the chart below does the trick nicely, and immediately conveys why this analysis is so vital - Selangor goes from having the highest number of registrants, to having the lowest registration rate:
Finally, even if you insist on showing the absolute numbers for each state, wouldn't it be better to present the data in a more easily digestible manner using a humble but effective bar chart? I really cannot stress enough how underrated bar charts are - they convey information much more clearly and directly than pie charts, fancy infographics, and most of the other dataviz options typically chosen by people going for style over substance.
Better data
Enough playing around with the data that's being released; let's talk about the critical data that isn't being put out there:
Number of actual data submissions.1 In the context of PADU, it is meaningless if you register for a PADU account (perhaps out of curiosity), have a look at the site, then decide you can't be bothered and log out permanently. Therefore, the PADU team needs to start providing information not just on registrations, but also on the number (and rate!) of actual eKYC-verified2 submissions. My guess is that fewer than 50% of those who registered actually made a verified submission.
Demographic breakdowns. By state, sex, age, and ethnicity at least,3 but preferably also by marital status, OKU status, and income bracket. This will immediately shine a light on whether the groups of highest concern (the elderly, the poor, the disabled, single mothers, etc) are being reached. Reporting these numbers is an absolute must for any national-scale program, especially one centred around data.
Completeness of submissions. On PADU, it is possible to ‘submit' your data even if you leave most of the fields blank. To judge whether this exercise is actually meaningful, and more importantly sustainble, the PADU team should report the % of fields completed by people who have submitted their data. Experience from surveys and censuses, especially those demanding a long time to complete (like PADU), tells us that many people may just give up halfway or even before.
Number of civil servant registrations and submissions. It was recently announced that civil servants were required to update their information via PADU. There is no issue with this instruction per se,4 but we should bear in mind that this may greatly distort the current trend, since civil servants are typically very compliant with circulars and instructions. It is therefore important that we know what proportion of PADU's coverage is coming from civil servants vs the rest.
Better dissemination of data
To compile the charts above, I manually typed out the numbers from 21 days' worth of infographics.5 It is a shame that I had to do this, since OpenDOSM comes equipped not only with programmatic access to their datasets (via API and via permalink to the full dataset), but also with high-quality dashboards that enable you to get insights right away even if you have 0 knowledge of how to process data on your own. I'd love to see a PADU dashboard on OpenDOSM, and I'm sure many others would too. The infrastructure is already there - use it!
Note - I am not saying there is anything wrong with providing an infographic. Malaysia's experience in the pandemic has shown us that citizens love a clean, consistent infographic they can track daily. However, similar to how MoH (eventually) supplemented their daily vaccination rate infographics with structured data on GitHub and the COVIDNOW dashboard, DOSM can also make this extra important step.
Conclusion
Provide better dataviz (DOSM is more than capable). Provide better data. And provide the data better. A richer and higher-quality data ecosystem will foster greater trust in the system, and enable society to more deeply understand and engage with what is a central national issue at present.
Audit
If, for whatever reason, you want to check the data presented above, all the code + data I used is open-sourced here:
Footnotes
You may or may not agree with the methodology of asking people to submit 39 pieces of information, especially for datapoints which the government should already have. However, that's a separate issue. ↩
This is another important point - some people may want to submit their data but find themselves unable to do so due to issues with the eKYC process. These issues are not the fault of the PADU team - industry benchmarks generally show that eKYC based on a picture of your IC will fail for 20-30% of the population. ↩
Sex, age, and ethnicity are the ‘big 3' demographic variables in Malaysia. You'll see me refer to them constantly in my work. Sex and age are standard dimensions to look at in any country; ethnicity is a particular focus for Malaysia. In countries like South Korea and Japan which are ethically homogeneous, this dimension is meaningless and is seldom collected, much less analysed. ↩
Note: There may be some duplication for civil servants who have filled in their profile in JPA's HRMIS system, which is more fine-grained than PADU due to its operational nature. ↩
Sure, I could have whipped up some automation with out-of-the-box OCR libraries, but it didn't seem worth it given that it only takes me a minute to type out manually. ↩